Introducing data driven financial risk management - what can we learn from baseball?
- Apr 22, 2021
- 9 min read
Updated: May 8, 2021
Talking about statistical modelling and data driven risk management in 2021 is much less unusual than it was in the early years of 2000 when talking about using statistical calculations to make decisions about undervalued or overvalued baseball players.
If you watched the movie Money Ball you know the story: the Oakland Athletics baseball team started to use statistical modelling in order to be able to mathematically calculate the odds that certain players will perform well throughout the season.
Being ridiculed in the beginning, even losing some games during the adjustment period, the coach proved this method to be a reliable one for making the right business decisions and ultimately winning 20 consecutive wins and the second place in the championship.
Today using statistical modelling is the standard in the baseball industry.
If we think about financial risk management in real estate and alternative investments we can notice that we are still in this pre-data driven stage. Even if some companies are getting more and more focused on gathering data, the analytics are still basic especially in low frequency data environments such as commercial real estate.
So, certain risks are prone to remain uncovered, connections between data points are endangered to be unrevealed, while the industry is still operating on best-worst case scenarios.
A Data Driven Environment
It is a data driven world out there, is it? But what does "data driven" even mean?
There is no use of having a data driven system if that system does not deliver value needed for achieving the business goals!
"Value data driven" first of all means to define your problem/ your topic/ your pending issue for which you will need a certain type of information.
What follows is to collect appropriate data, organise the data in a form that you can get hands on when you need it and to start to analyse the data with the aim to solving your topic at hand.
Particular value is being provided when advanced data analytics methods are used - this reveals new information, hidden patterns or different point of views which others do not see and therefore puts you in a competitive advantageous position.
Advanced data analytics covers a lot of different methods and always depends on the respective circumstances and goals. It can take the form of a simple prescriptive analytics, follow up with business analytics over a grid of business relevant metrics, incorporate predictive analytics applications respectively follow dynamic developments with the help of network analytics.
Whatever the case, data driven business frameworks and data driven decision making means preparation, a lot of preparation and advanced, custom made analytics!
And certainly, you do not want to sit at the negotiation table opposite to somebody who is much better prepared than you yourself.
For those who want to go more into details, here is a case study we did at a Harvard University Data Science course on Inference and Modelling, where Prof. Rafael Irizarry explained how to put yourself into an advantageous position backed by a data driven support.
An Overvalued Asset
Starting Point
The year 2013 and a baseball team has a young and quite unknown player, called José, who did extraordinarily well in the first part of the baseball season as he showed the following performance metrics:
Date I At Bats I Hits I Batting Average
---------------- I-----------------------I-----------------------I--------------------------
April I 20 I 9 I 0.45
A Batting Average of 0.45 would make José one of the most successful players as the record for the Batting Average so far is 0.4 and was achieved 72 years ago in 1941.
So, do we see a big talent here of whom we can expect to break the old record of the year 1941 or was it just luck that José performed so exceptionally well?
Again, we can make an educated guess or do some preparation and try to retrieve the information from the data which is available to us. In this case, we decided to follow the data and try to predict José's Batting Average at the end of the current season.
Technically, we use a Hierarchical Model/ Bayes Statistics.
The Data Framework
In a typical season, players have about 500 At Bats.
Filtering the last three seasons, i.e. the years 2010, 2011 and 2012, for all the players with at least 500 At Bats reveals a Batting Average of 0.275. Here is the summary statistics:
Batting Average
Seasons I At Bats I mean I standard deviation
----------------------------------------------------------------------------------------------------------------------
2010, 2011, 2012 I 500 I 0.275 I 0.027
and José's performance beginning of the season 2013
Batting Average
Season I At Bats I mean I standard deviation
-----------------------------------------------------------------------------------------------------------------------
running 2013 I 20 I 0.45 I 0.111
José's Batting Average of 0.45 is therefore more than 6 standard deviations away from what usually can be expected as Batting Average in a baseball season which qualifies him for a clear outlier. The concerning question here is, did this happen due to José's huge talent, was this just a lucky punch or is it due to both factors?
The Hierarchical Model
In short, the hierarchical model provides a mathematical description of (in this case) how to see the observation of a Batting Average of 0.45 with José.
And as for the hierarchy, we have two levels to take into account:
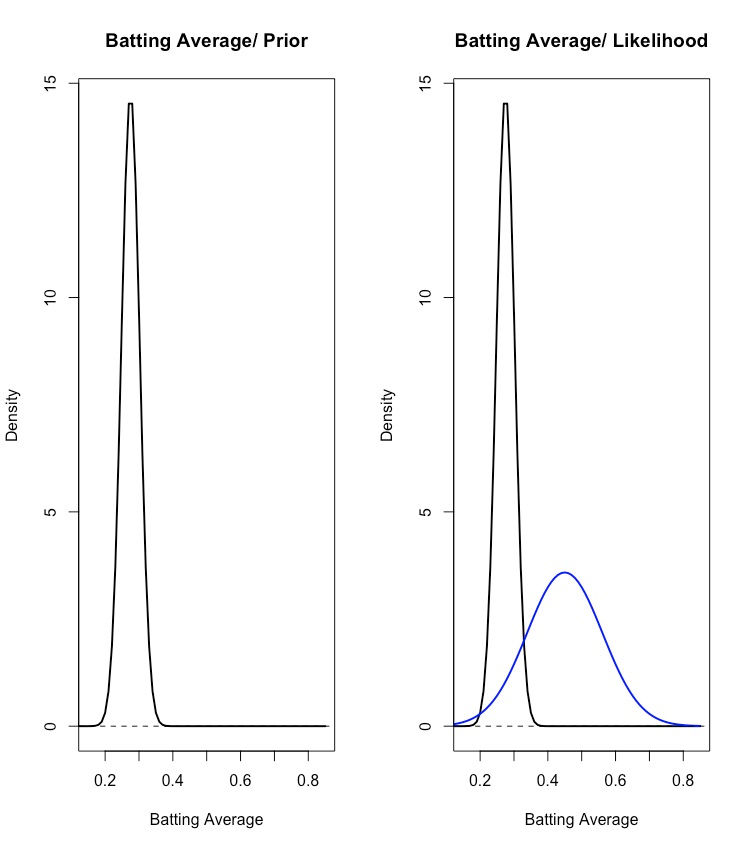
First Level: This level takes the player-to-player variability into account and is summarised as prior distribution. In other words, the Batting Average is now a random variable (denoted as p) which describes the randomness in picking a player.
Second Level: This is the level on the one chosen player and represents the variability due to luck when batting. It is summarised in the sampling distribution (likelihood). In other words, this is the distribution of the Batting Average (denoted as Y) of one player GIVEN that this player has a talent p.
Based on examining the seasons 2010 to 2012 we know, that the Batting Average follows a normal distribution. Visualised, there is the following situation where you also can see how exceptionally José is doing at the moment:

The rest of this sub-chapter is getting a bit technical. If you are not interested in those details just move to the next sub-chapter/ 'Prediction Results for José'. You will not lose too much of information.
Mathematically, there is the following situation:
p ... the Batting Average as random variable
mu ... the mean of the Batting Average for the seasons 2010, 2011 and 2012 - equalling 0.275
tau ... the standard deviation of the Batting Average for the seasons 2010, 2011, 2012 - equalling 0.027
Y ... the Batting Average of one player; for José this equals to 0.45
sigma ... the standard deviation of one player's Batting Average;
for José this equals to sqrt(0.45 * (1 - 0.45) / 20) = 0.111
Y|p ... the Batting Average of one player given that this player has talent p
p ~ N(mu, tau^2) = N(0.275, 0.027^2) ... the overall Batting Average is normally distributed;
parameters mu and tau are derived from the observed situations
in the seasons 2010 to 2012 - this is the PRIOR
Y|p ~ N(p, sigma^2) = N(p, 0.111^2) ... once again, this is the Batting Average of one player (in our case José) but
given that this player has talent p;
and exactly this talent p we try to estimate - this is the LIKELIHOOD
So, now we are ready to compute the so called posterior distribution in order to summarise the prediction of p:
E(p|Y) ... expected value of the Batting Average given the current Batting Average of this one player
In case of Josè this means:
E(p | Y=0.45)
and
E(p|Y) = B*mu + (1-B)*Y or simply = mu + (1-B)*(Y-mu) ... the mean of the posterior distribution
with
B = sigma^2 / (sigma^2 + tau^2) ... this is in fact a weight which is indirectly impacted
by the size of the sampling distribution;
the smaller the size the more the weight is with the prior;
due to the early season, José's size is quite small with
20 At Bats compared to the average size of 500 At Bats
for an ordinary player during a whole season
and
sd(p|Y) = sqrt(1 / (1/sigma^2 + 1/tau^2)) ... the standard deviation of the posterior distribution
resulting in
p|Y ~ N(E(p|Y), sd(p|Y)^2) ... this is the distribution of the Batting Average which is
predicted for one player for the whole season and is
also normally distributed - this is the POSTERIOR
Prediction Results for José
So, in terms of the Batting Average how do we
predict the performance of José for the overall season 2013 (- the posterior distribution)
based on what we saw up to April (- the likelihood distribution)
and based on what we saw from the seasons 2010 to 2012 (- the prior distribution)?
In other words:
p|Y=0.45 ~ N(expected_BattingAverage_José = 0.285, (standard.deviation_BattingAverage_José = 0.026)^2)
Hence, within a 95% credible interval we expect José to have a Batting Average for the whole season of 2013 in the range of 0.285 +/- 0.052, i.e. an expected range between 0.233 and 0.337.
Here is the whole process visualised:
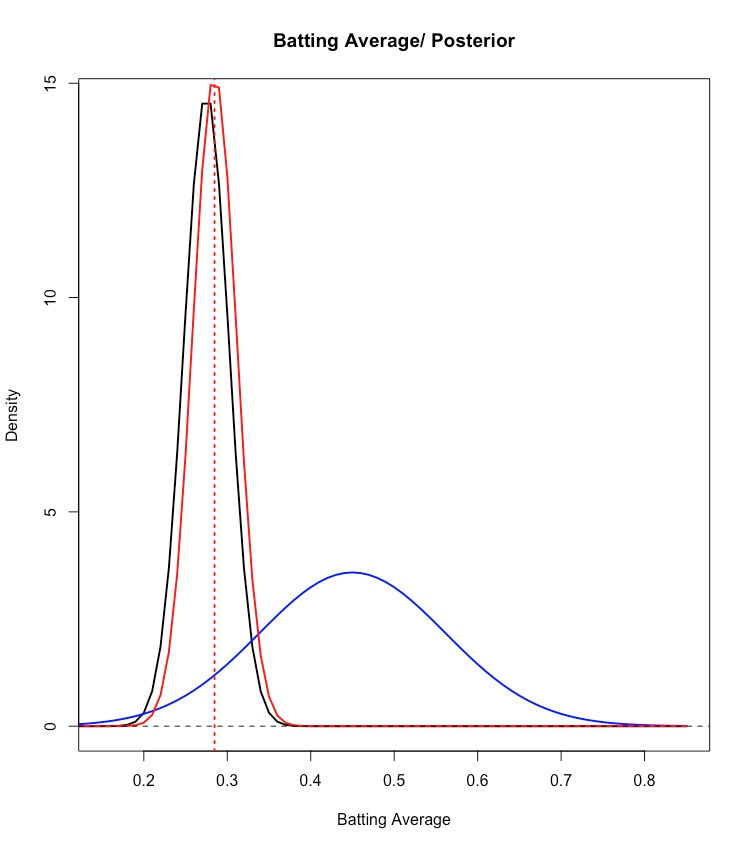
Needless to say that the expected Batting Average range between 0.233 and 0.337 is far off the current extraordinary performance, José showed during the early stage of the season (i.e. a Batting Average amounting to 0.45)!
Data Driven Consequences
With those data driven considerations in hand, the management of José's baseball team understood that most likely the extraordinary performance which José showed in the early stage of the season can be more attributed to luck than to an extraordinary talent. With the ongoing season, it is therefore to be expected that the performance will flatten out and will move to the market average.
The management also understood that other baseball teams were quite impressed by José's current Batting Average of 0.45 and that those teams saw this as heavy indication of an extraordinary talent. Obviously they did not put so much emphasis on a data driven decision making process.
Put another way, José as a baseball player was an overpriced asset for his team!
Realising this, José was sold to another team for really good money.
The Batting Average of José for the rest of the season was as follows:
Month I At Bat I Hits I Batting Average
------------------------------------------------------------------------------------------------
April I 20 I 9 I 0.45
------------------------------------------------------------------------------------------------
May I 26 I 11 I 0.423
June I 86 I 34 I 0.395
July I 83 I 17 I 0.205
August I 85 I 25 I 0.294
September. I 50 I 10 I 0.200
==========================================================
May - Sept I 330 I 97 I 0.294
===================================================
Indeed, the exceptional performance flattened out over the rest of the season and stayed a notch above baseball league average.
Conclusion
I hope, this example shows the absolute necessity of introducing the data driven decision making process in different areas of the business especially when it comes to financial risk.
The prospect of a data driven organisation is manifold and ranges from the seizure of opportunities, e.g. the cash-in of overpriced assets, to the effective detection and handling of risk exposures, e.g. the revealing of disguised cluster risks in a portfolio.
As mentioned in the beginning, to run a data driven environment smoothly and efficiently a lot of preparation is required. Additionally, a data driven culture, technical Know How and sufficient business experience is to be incorporated. Provided this, there are huge possibilities to monetise the value of data.
Remember the baseball example from above or Moneyball. Not too long ago, the application of statistical concepts in the baseball industry was completely out of scope. Meanwhile, it is a proved concept and the absolute standard in the baseball industry. Any baseball team which wants to get on the top or stay on the top cannot afford not to incorporate those concepts in their operations. But first and as the movie shows, this was once a new concept and someone with a vision proved it to be right.
In fact, I do not see any other way for a corporation but to transform into a data driven corporation and to take any help it can get in order to achieve this transition.
Otherwise you are the entity which is not prepared which could mean that:
you are participating in a tender for a NPL - portfolio while your competitor used Deep Learning applications to understand the repayment behaviour of those portfolios and knows quite well when to stay in the game and when to walk away
you are losing time in still trying to gather additional data while your competitor uses synthetic data to train its machine learning tools for the next CAPEX budget round
you are entangled in what-if scenarios like "what happens to the equity yield when the investment yield goes up or down by 5 %..." while your competitor runs a full market embedded portfolio simulation in order to define its mid- to long-run investment strategy
you think your asset portfolio is well diversified while your competitor revealed unexpected cluster risks and already starts to reallocate its investments
you are the one who purchases José.


Comments